
A breakdown of Mav's playbook analytics.
To access Mav analytics, browser over to "Playbooks" and then click the "Analytics" button.
Once, inside you'll see our analytics screen for your selected Playbook.
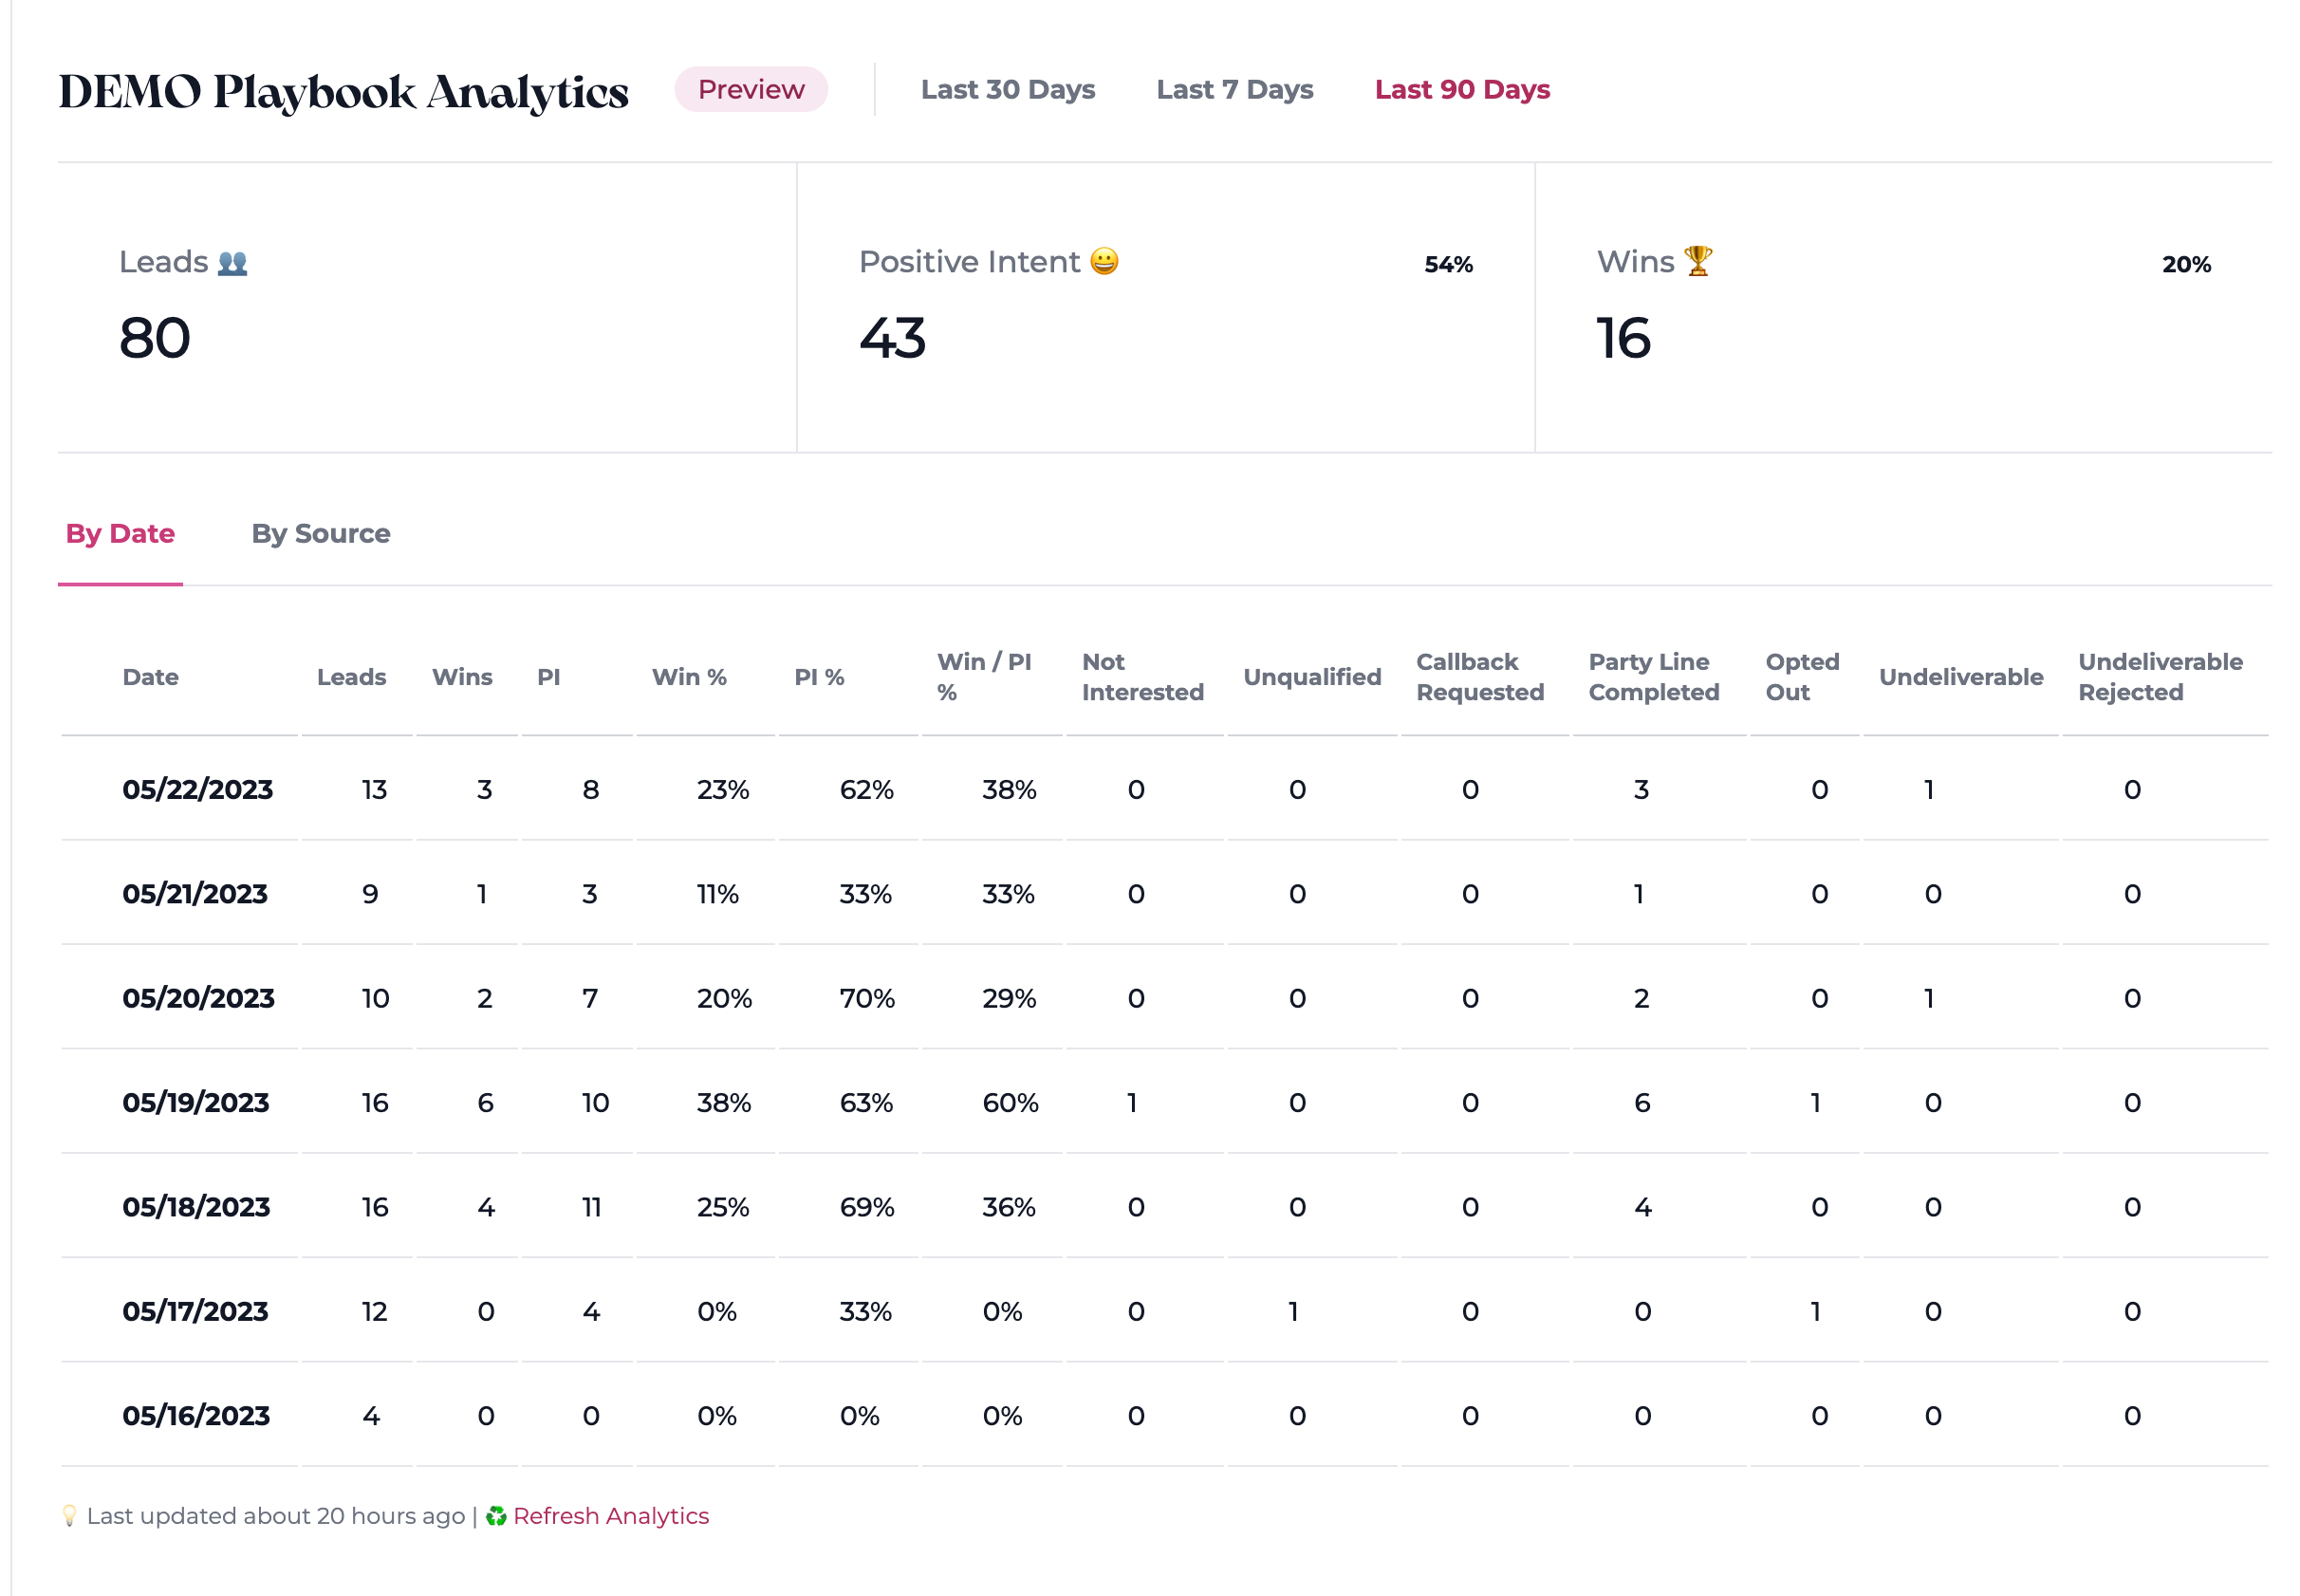
Top Line Metrics
For your selected date frame, you'll see 3 top line metrics:
- Leads - Total leads for that period or source.
- Postive Intent - Total leads for that period or source that have expressed positive intent.
- Wins - Total leads for that period or source that have resulted in an positive outcome (Party Line, Call Back, Link Click, etc)
Below the top line metrics, you'll see a table grid of metrics broken down by Date or by Source. The columns are comprised of our reporting events.
Metrics by Date - If the "By Date" tab is selected you'll see a historical view of leads inserted for that calendar date.
Metrics by Source - If the "By Source" tab is selected you'll see a historical view of leads broken down by source and then sub-nested would be any sub-sources.
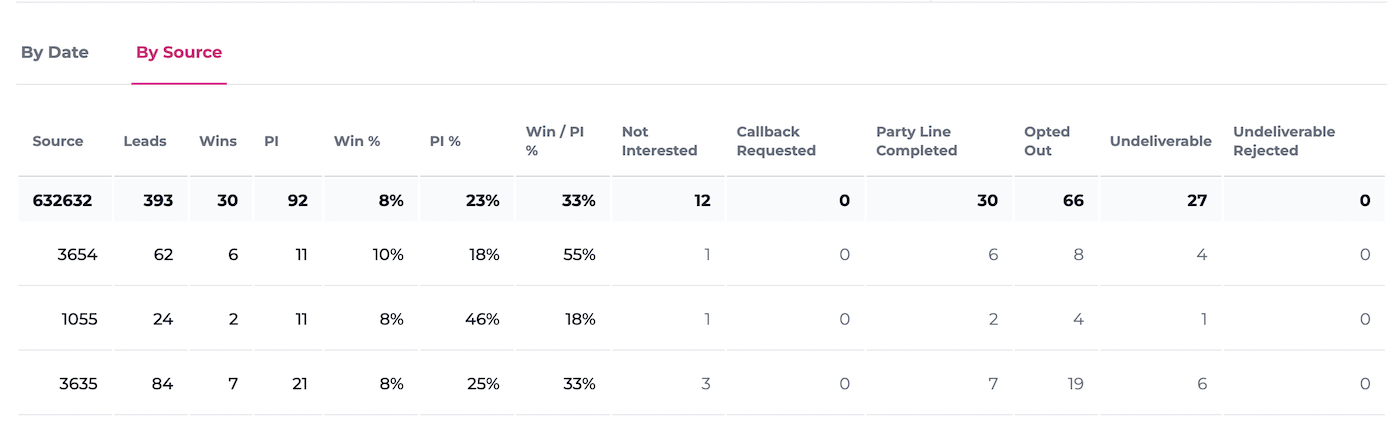
In this example 632632 is the source and 3654, 1055, 3635 are the sub-sources. Viewing analytics by source can be an extremely powerful way to validate lead sources, campaigns, or digital ads.
💡 Pro Tip: Check out Playbook Alerts to set alerts on Positive Intent Rates or Outcome Rates. This allows you to react to changes in your lead data quality quickly and pragmatically.